
A Story of the Financial Crisis in 2008 Told by A Mortgage Dataset
\[\\[0.2in]\]
\[\\[0.2in]\]
Our motivation of to have a deeper analysis on our mortgage dataset mainly comes from the movie “The Big Short”.
\[\\[0.2in]\]
In 2005, eccentric hedge fund manager Michael Burry discovers that the United States housing market, based on high-risk subprime loans, is extremely unstable. Anticipating the market’s collapse in the second quarter of 2007, as interest rates would rise from adjustable-rate mortgages, he proposes to create a credit default swap market, allowing him to bet against, or short, market-based mortgage-backed securities, for profit.
\[\\[0.2in]\]
His long-term bet, exceeding 1 billion, is accepted by major investment and commercial banks but requires paying substantial monthly premiums. This sparks his main client, Lawrence Fields, to accuse him of “wasting” capital while many clients demand that he reverse and sell, but Burry refuses. Under pressure, he eventually restricts withdrawals, angering investors, and Lawrence sues Burry. Eventually, the market collapses and his fund’s value increases by 489% with an overall profit (even allowing for the massive premiums) of over 2.69 billion, with Fields receiving $489 million alone.
\[\\[0.2in]\]
The background of the movie is the well-known subprime mortgage crisis which was a multinational financial crisis occuring between 2007 and 2010 that contributed to the 2007–2008 global financial crisis. The collapse of the housing bubble is the trigger for the crisis.In a crazy time when most people hopes to get rich by bidding on the real estate industry and relative mortgages securities, Micheal Burry trusted his intuitive and predicts that US mortgage markets will collapse based on his experience. However, as data scientists, we trusted more in our data and analysis. With deeper analysis into our dataset, we started to find out that Burry’s success is not by luck, which seems meant to be happen.
\[\\[0.2in]\]
In-depth Look into Default Rates with other Variables
We believe that a overheating housing market and tremendous unsupervised mortgages is the prime culprit for the collapse of US economy in 2008.
\[\\[0.2in]\]
\[\\[0.2in]\]
In light of the 911 attack and the collapse of Dot-Com bubble in around 2001, The Bush government implemented a bunch of policies to increase home ownership in the US to avoid recession. The key for increasing house ownership is mortgage. It has long the main way for people to get their houses–they borrow money from the bank to buy a house, leaving a security interest on the house back to the bank. However, the price of a mortgages mainly depends on its interest rate–The higher the interest rate is, the more expensive a mortgage is. By that time, average interest rate is very high in around 10%, which is unaffordable for the general public. Therefore, to help make mortgage more accessible, the Federal Reserve decided to lower the federal funds rate, which is positively correlated the average mortgage interest rate.The Bush government hopes that by lowering federal funds rate, the average interest rate for mortgage nationwide will decrease as well, making house more affordable and inciting US economy. Reflected by our datasets, the government did success for a while…
\[\\[0.2in]\]
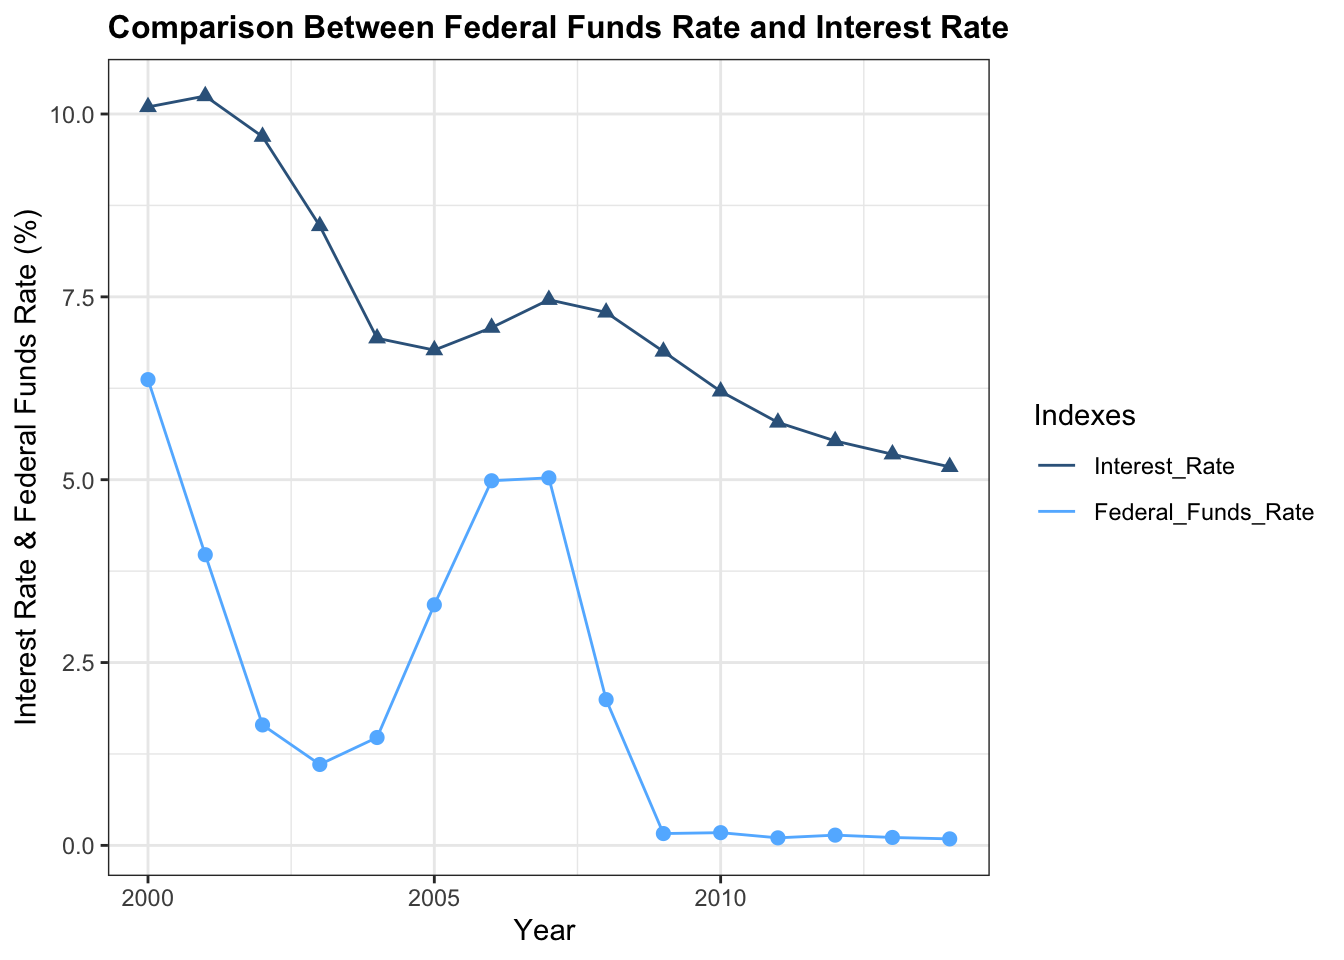
Insights of Covariance of Interest Rate and Federal Funds Rate
\[\\[0.2in]\]
\[\\[0.2in]\]
As we can see from the chart, mortgage interest rate almost ups and downs with the Federal Funds Rate simultaneously. From 2000 to mid 2003, both rates experience a sharp decrease because of federal reserve’s policy. As the federal funds rate started decreased, average mortgage interest rate began to decrease at the same scale. It dropped from maximum at 11% to minimum at 6.5% in just three years, which is almost a cut in half. Apparently, such a reckless policy has profound effect on the housing market and real estate industry–To have a house is not a dream anymore for most people at that time. As more people can afford a mortgage, the need for house skyrocketed as well, leading the prosperity of the real estate industry, which can be reflected by Dow Jones Real Estate Index and number of newly issued mortgages.
\[\\[0.2in]\]
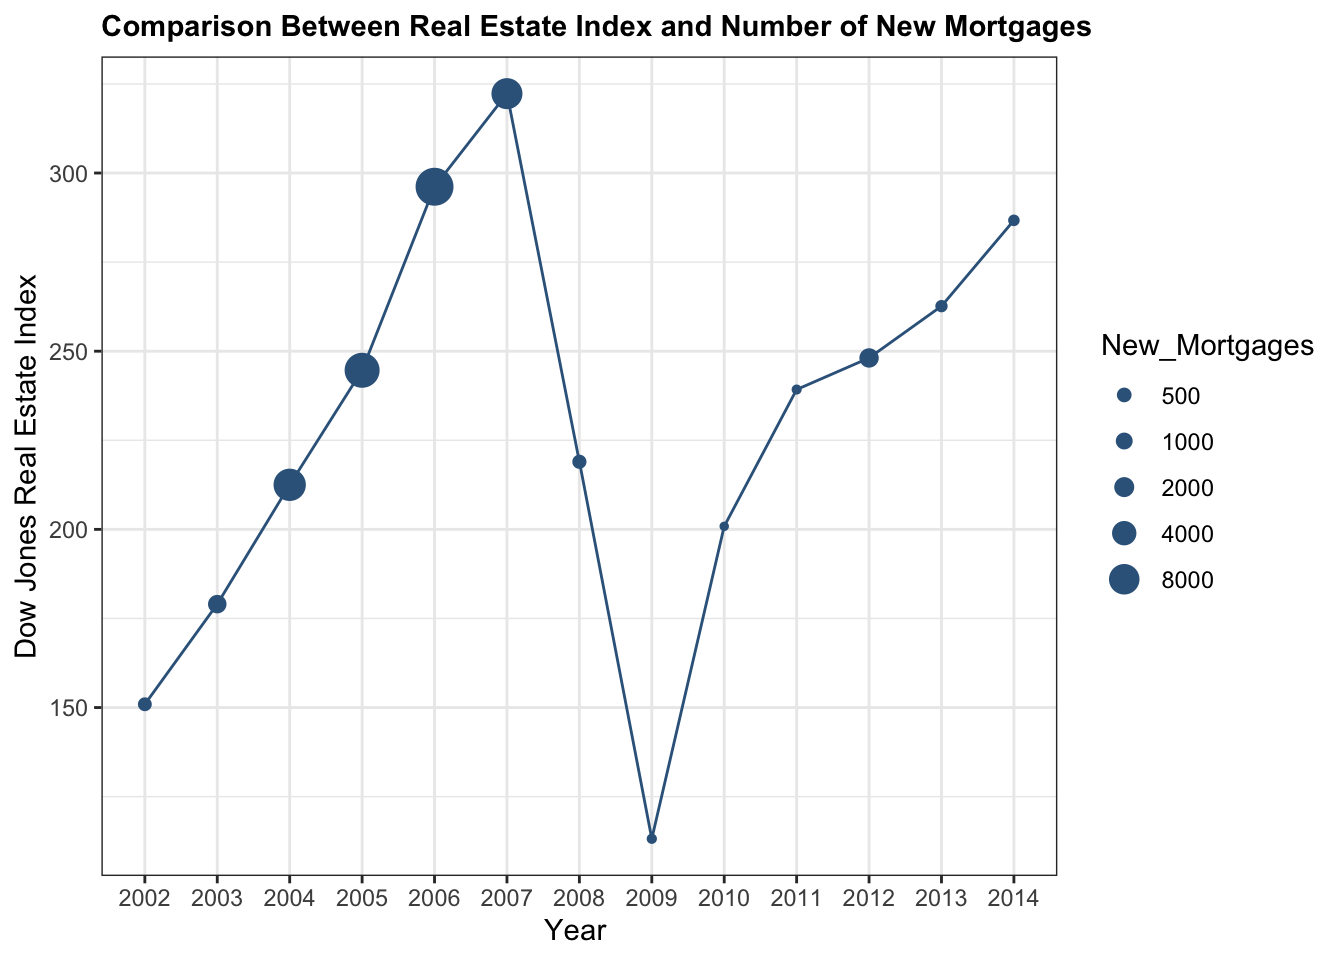
How Does Number of New Mortgages Relate to The Real Estate Index
\[\\[0.2in]\]
\[\\[0.2in]\]
As we can see from 2002 to 2007, the whole real estate industry developed in an unprecedented speed from just 150 in 2002 to almost 350 in 2007 in real estate index. At the same time, the number of newly issued mortgage also rises in an unimaginable speed, from less than 500 to 9000 in 2006 reflected by our dataset(We have a randomized selection of 50000 mortgage ranges from 2000 to 2015).The whole housing industry were still rising even right before the global financial crisis. Many get rich, many get their houses–It seems like every American are going to have their own houses. However, life has never been so easy. Things developed in a totally different way than everyone expected. Need for houses cannot catch up for supply for them. The overheating housing market eventually leads to a bubble, resulting the decrease of house price. As we can see from the following chart, the supply and demand of houses determines that the legend in real estate cannot last forever.
\[\\[0.2in]\]
US Housing Market Status and House Price Index
\[\\[0.2in]\]
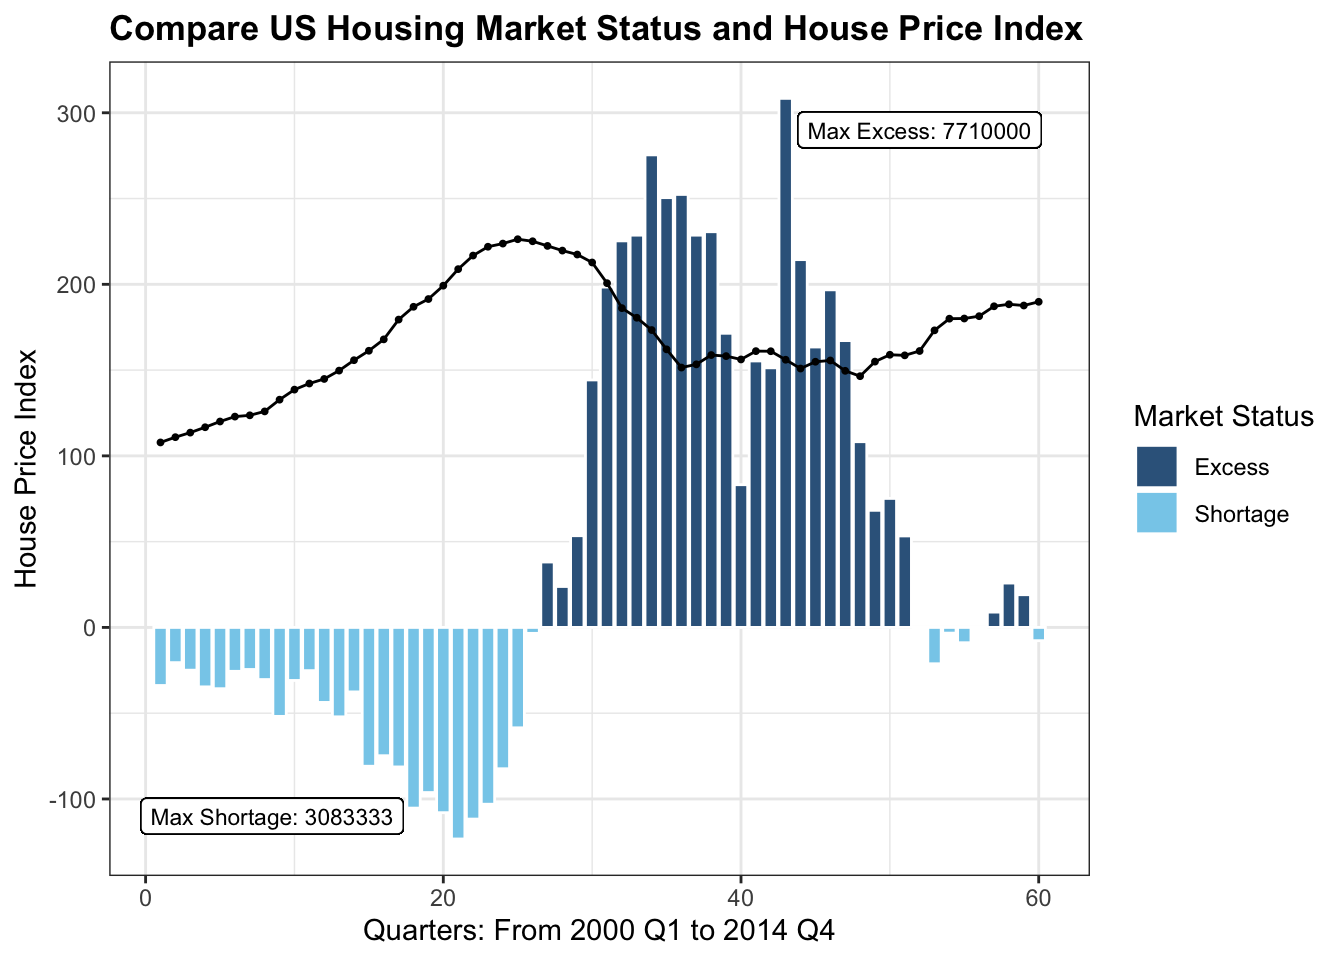
From Q1 in 2000 to around Q1 in 2006, the housing market was still in shortage, which means that demand for houses are much larger than supply for houses. The lower interest rate directed by government policy was the major cause for such shortage. As more people chasing for a house, the house price index rises from about 100 to around 220, with maximum shortage of about 3 millions houses. Such a gap was finally filled by crazy growing real estate industry reflected by the last chart–Everyone wanted to do business! Therefore, stared from Q1 in around 2006, the supply for houses started to exceed the demand for houses. Along with that was the sharp decrease of the house price index from 220 back to around 150. With the collapse of prices, the housing bubble finally burst. However, why did such collapse in price leads to default in mortgage and finally the economy crisis? The answer is inside the definition of adjustable-rate mortgage. ARM is type of mortgage in which the interest rate applied to the outstanding balance varies throughout the life of the loan depending on the market, which is prevalent before the subprime mortgage crisis.
\[\\[0.2in]\]
Distribution of Adjustable & Non Adjustable Rates
\[\\[0.2in]\]
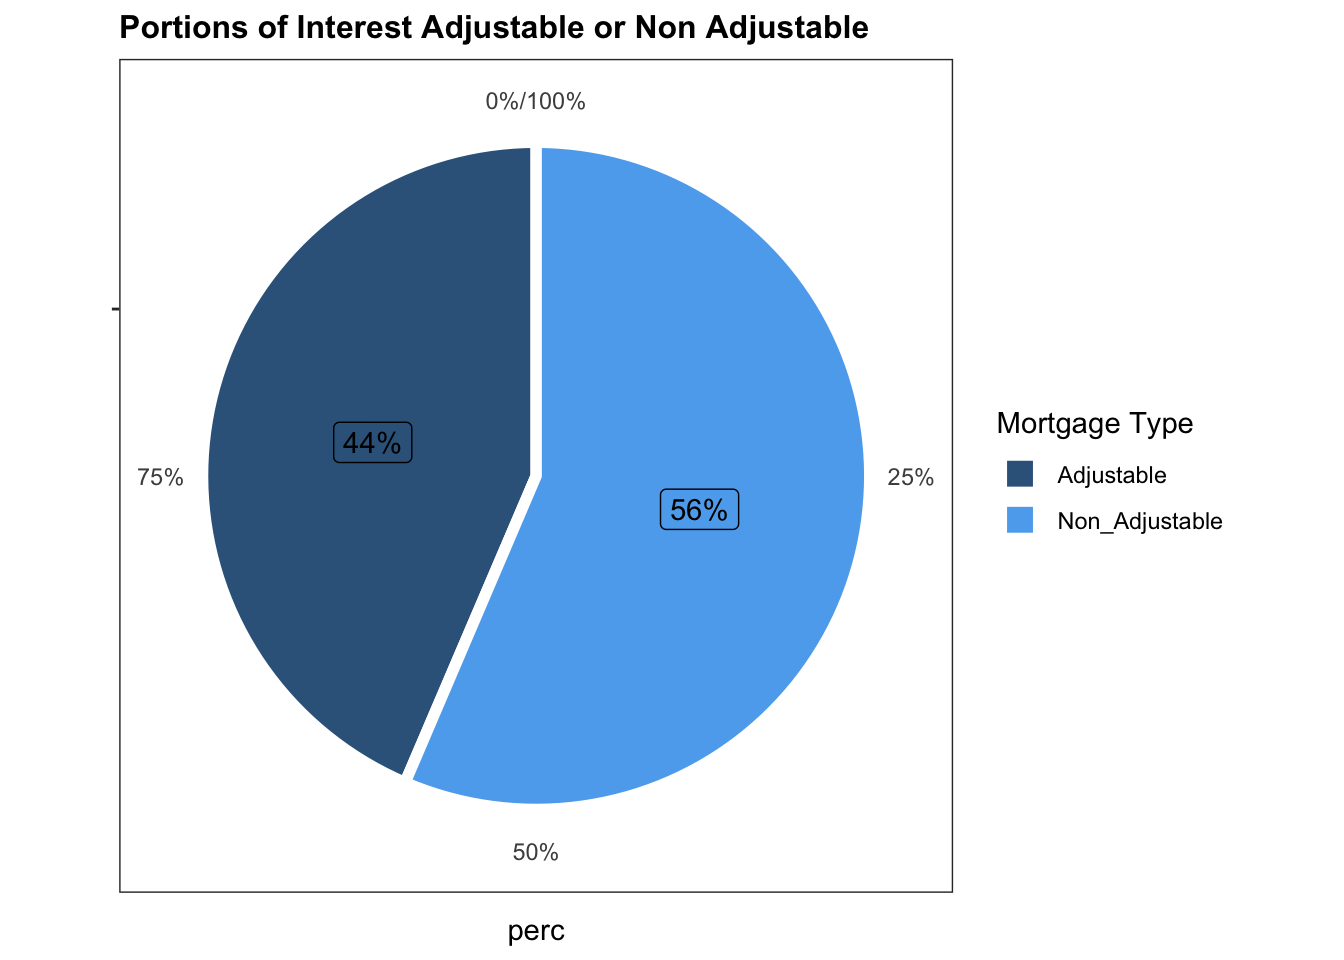 At that time, under the premise of loose credit and the belief that house prices will continue to appreciate, many subprime borrowers are encouraged to obtain floating-rate mortgages.As we can see from the chart, about 41% of mortgage at that time are with adjustable interest rate. These mortgage loans lure borrowers at lower than the market interest rate for a predetermined period, and the rest after that period is calculated based the market interest rate, which means that the borrowers has to bear the burden for the market. Meanwhile, borrowers who cannot make monthly payments in time before the end of the grace period will probably try to refinance their mortgages. Once real estate prices start to fall in many states, refinancing becomes more difficult. More and more banks refuses to give loan for these worthless houses anymore, resulting a higher interest rate. Borrowers who found themselves unable to get rid of higher monthly payments through refinancing began to default…
\[\\[0.2in]\]
How Does Default Rates Relate to Interest Rates
\[\\[0.2in]\]
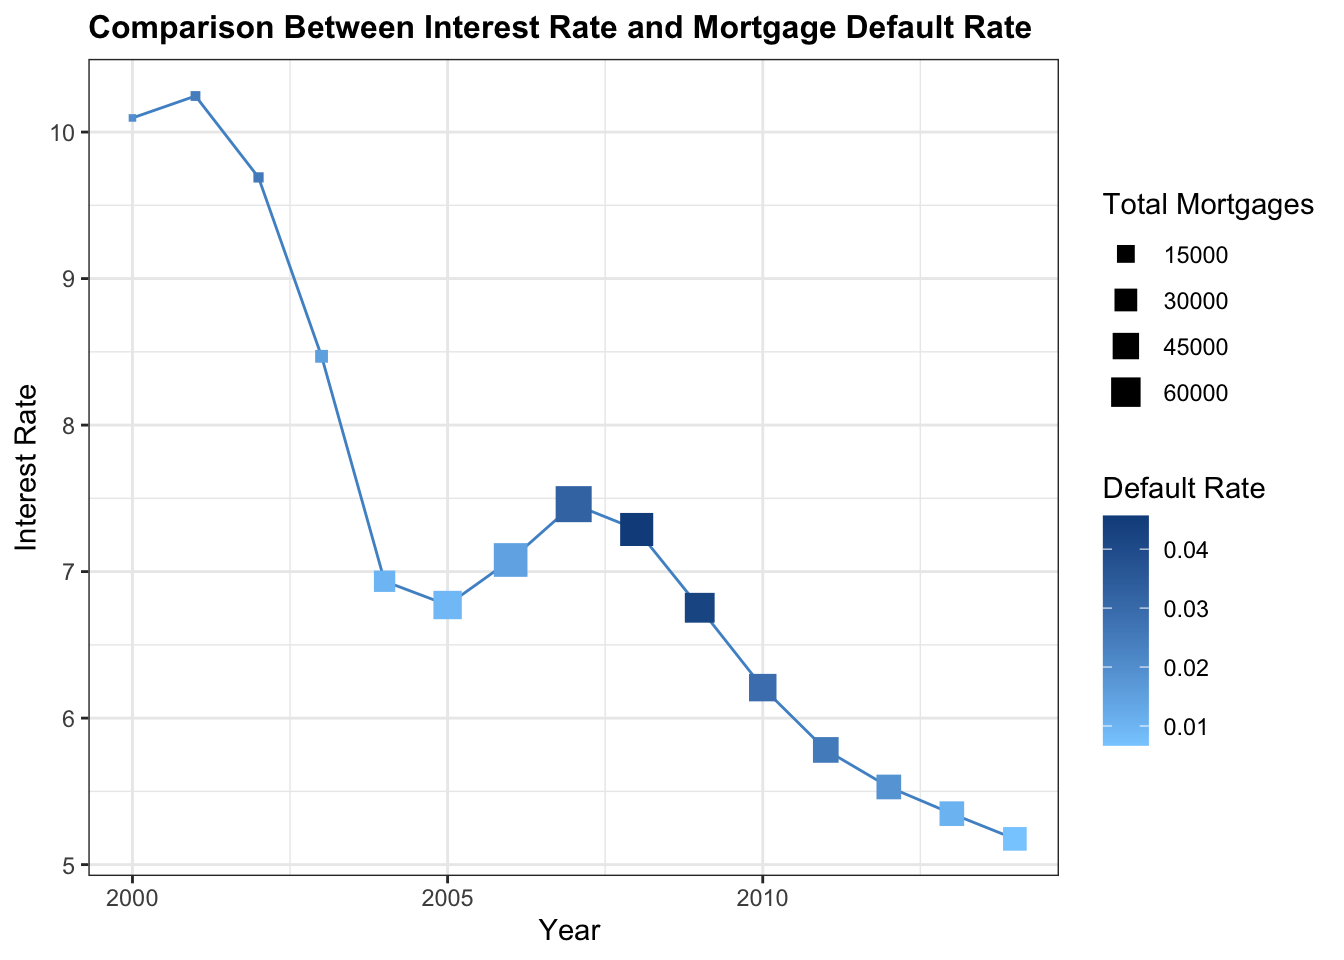
As the interest rate goes higher from 2005 to 2006, mortgage default rate started to tremendously increase. From 2007 to 2008, about 4 percent of total mortgages ended in default in just two years, which is a very shocking number. As more and more borrowers stop paying their mortgage repayments, foreclosures and homes for sale increases in addition. This puts housing prices under downward pressure, which further reduces the net worth of the homeowners’ asset. The decline in mortgage repayments also reduces the value of mortgage securities and weakens banks’ assets and financial conditions. This vicious circle is at the core of the crisis. The subprime loan default triggered a broader global credit crisis, which leads to the collapse of more debt bubbles including commercial real estate mortgages, credit cards, car loans, and student loans…Large amount of defaults not only in mortgage but also in its financial derivative finally triggered the systemic crisis and lead to the collapse of US economy.
\[\\[0.2in]\]
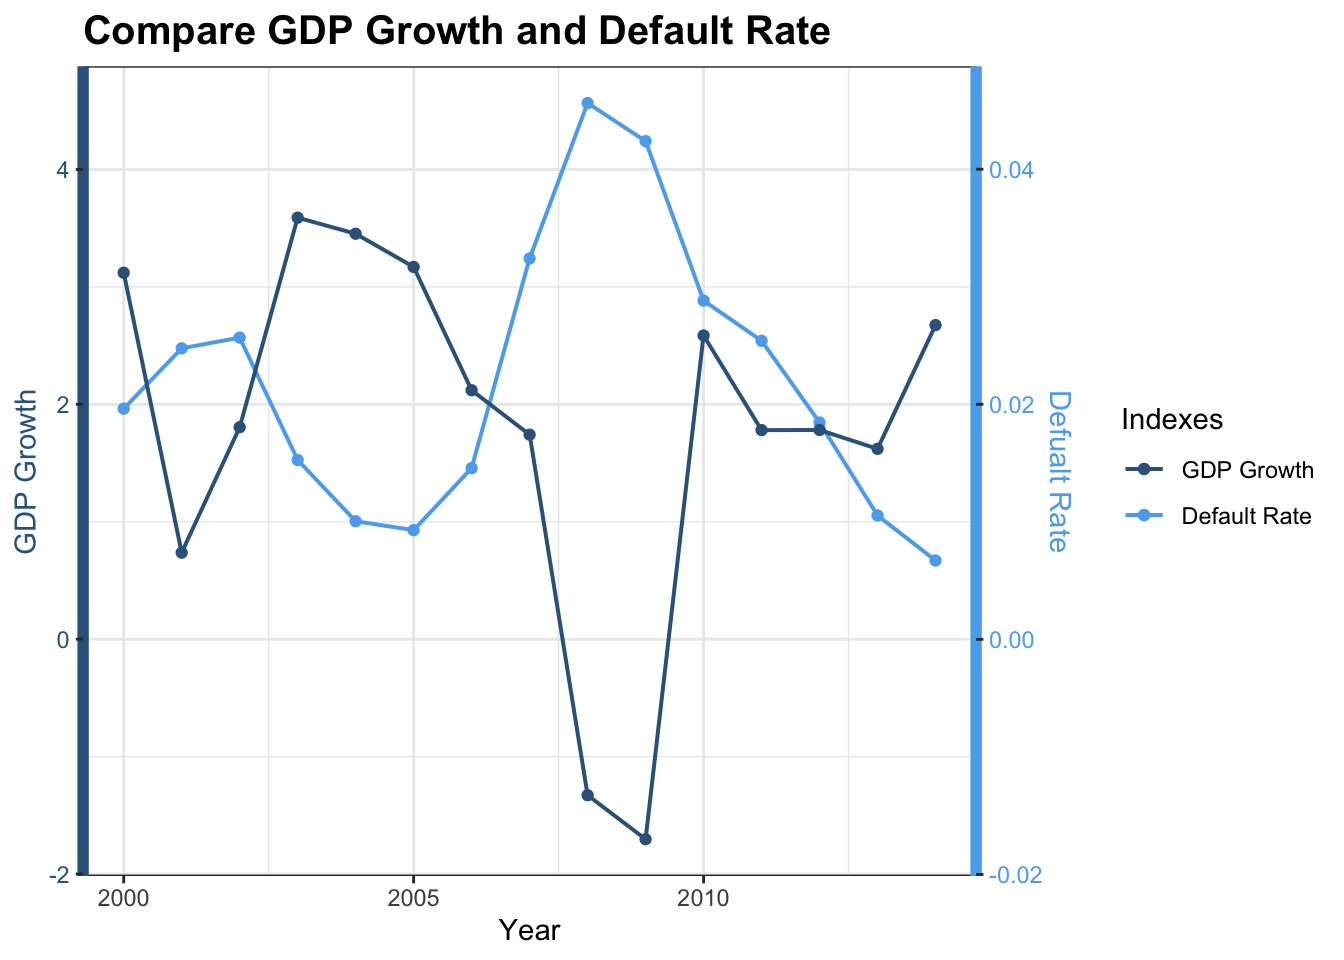
How Does Default Rate Varies Within GDP’s Changes
\[\\[0.2in]\]
 \[\\[0.2in]\]
As we can see from the chart, mortgage default rate and GDP growth is in a strongly negative correlation. As the default rate rises, the GDP growth decreases in a unprecedented speed. This vicious circle continued–High mortgage default rate lead to low GDP growth, and the low GDP growth again lead to a even higher default rate. As the default rate goes up to the maximum point at around 4 percent in 2008, the GDP growth also hit the lowest point at - 2 %, which corresponds to global financial crisis in 2008. In this crisis, many large financial institutions went bankrupt, the stock market plummeted, and capital fled. Many multinational companies also went bankrupt and reorganized due to financing difficulties. Not only did people lose their houses, they also lost their jobs, and the unemployment rate skyrocketed, triggering social unrest. The impact of the crisis not only swept across the United States but also radiated to the world. Many developed countries ran out of foreign exchange. Manufacturing industries in developing countries also shrunk dramatically. People who made a fortune in the housing bubble in 2003 would never have thought that unregulated mortgages would eventually lead to this disaster for all mankind.
\[\\[0.2in]\]
All these data tells us how unregulated mortgage can affect the economy of US or even the globe. Therefore, it is very important to model the credit risk of mortgage. After the crisis, the government and Central Bank strengthened the regulation on residential mortgage market.These regulations have strengthened the disclosure of borrowers and strengthened the monitoring of mortgage credit risk. As data scientist, we believe that our analysis backed to a mortgage dataset during the crisis will be valuable. We would like to make a model and that can measure the likelihood of default with some personal information of the borrower and economic data. Loaners must be responsible for make sure that are lending to someone treatable. We hope that our work can prevent another economy crisis in the future.
\[\\[0.2in]\]
Below is our interactive part, which measures default specific mortgage and enable readers to have a glance at US mortgage market from 2000 to 2014.
\[\\[0.2in]\] Interactive Page
\[\\[0.2in]\] Many Variables are believed to influence the default behavior, and it is inadequate for a single page to present correlation between different variables and look into specific segmentation, so we build an interactive page to provide a more in-depth look. We encourage scholars to take a look at the interactive page to further see how different variables play a role.
\[\\[0.2in]\]